
GLOBAL WARMING: A STATUS CHECK
By Bruce McCabe
September 21, 2026
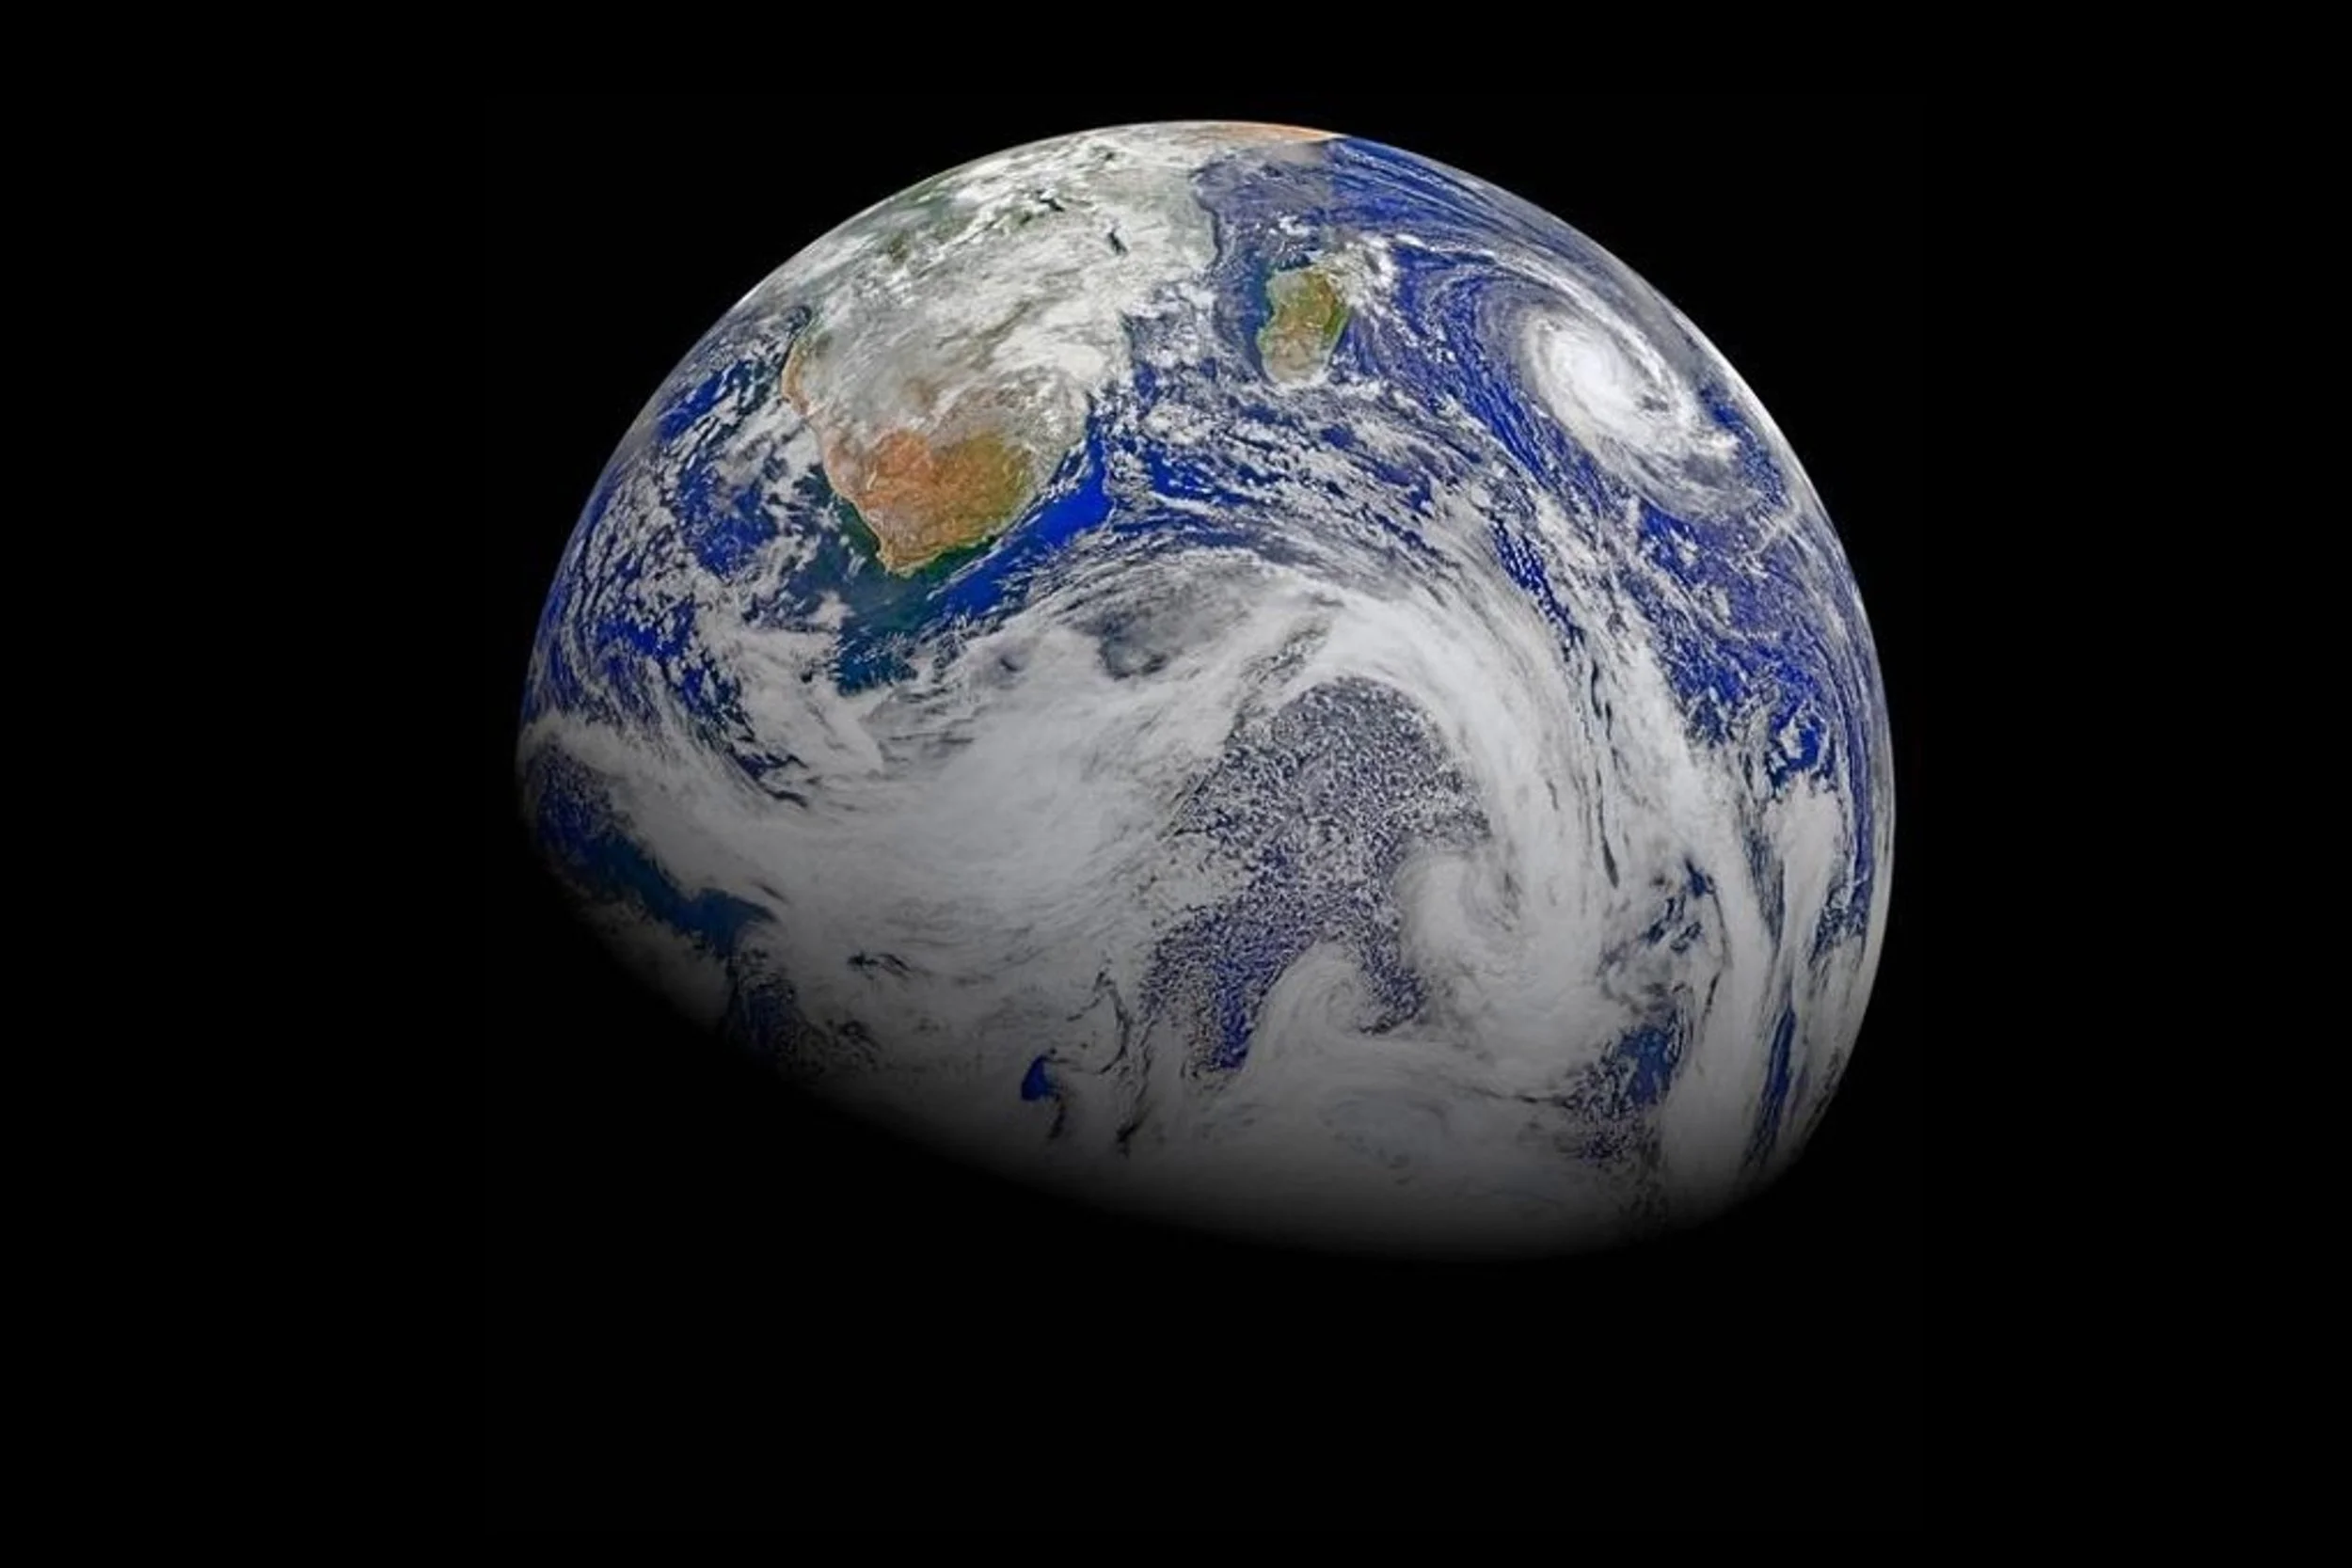
Image source: NASA
Emissions
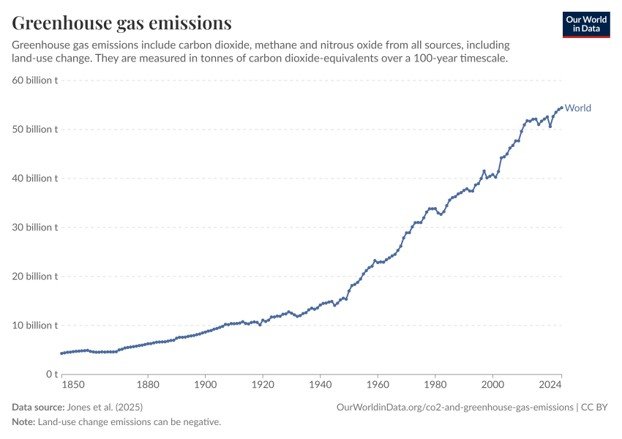
Greenhouse gas emissions for 2025, including all energy, agriculture, industrial process, waste, land-use change and forestry sources, and measured using the CO2e 100yr standard, totalled 59.7 Billion tonnes. This was an 0.3% increase in the annual emissions rate from 2024 (59.5 Billion tonnes).[i]
Electricity production accounted for 16 Billion tonnes. Forestry and land-use change, including releases from fires, came to 13.4 Billion tonnes. Transportation accounted for 9.5 Billion tonnes. Agriculture, including crop residues, crop fires, enteric fermentation in cattle, fertilizer application and so on totalled 5.8 Billion tonnes. The remainder was made up of releases from industrial processes, buildings, fossil fuel operations, mineral extraction and waste.
China accounted for 30% of global emissions in 2025, the US accounted for 12% and India 7%.
The annual global emissions trend 1850 – 2024 is below.[ii]
Concentrations
CO2
CO2 drives 80 percent of the increased heating power of the atmosphere due to greenhouse gases.
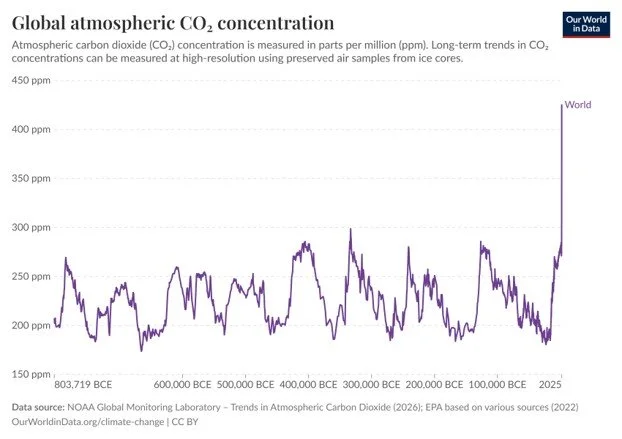
The global average atmospheric concentration of CO2 was around 425.3 ppm for 2025, 53 percent higher than pre-industrial levels, an 0.6 percent increase on 2024 levels (422.7 ppm), the highest ever recorded, and the highest concentration at any time in at least two million years.[iii] [iv]
Concentrations have continued to track upwards at a rate of roughly 2.6ppm per year since 2015. Continued high annual emissions as well as weakening land/ocean carbon sinks are driving the increase.
Only a small fraction of each year’s added CO2 is reabsorbed within 100 years. Roughly 80 percent will remain in the atmosphere for hundreds to thousands of years. Some of it will trap heat for tens of thousands of years. As the capacity of oceans and plants to take up additional carbon reduces, the lifetimes are getting longer. [v]
Methane and nitrous oxide
Methane is responsible for about 7.3 percent of the increased heating power of the atmosphere due to greenhouse gases. Nitrous oxide is responsible for about 6.5 percent.[vi]
The global average atmospheric concentration of methane was 1897 ppb for 2025 (up 7ppb or 0.4 percent on 2024 levels of 1890 ppb), 166 percent higher than pre-industrial levels, the highest levels recorded and higher than at any time in at least 800,000 years.
The global average atmospheric concentration of nitrous oxide reached 339 ppb for 2025 (up 1.22 ppb on 2024), 26 percent higher than pre-industrial levels, the highest recorded and higher than at any time in at least 800,000 years.[vii]
The atmospheric concentration trend for CO2 for the last 800,000 years is below.
Temperature
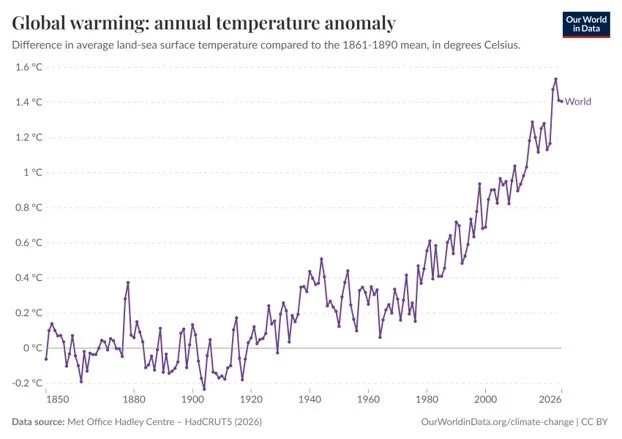
2025 was the third warmest year on Earth since 1850, exceeded only by 2024 and 2023. The global average temperature was 1.44 °C above the average baseline for 1850-1900. The land temperature anomaly was 2.03 °C and the ocean temperature anomaly was 1.03 °C.
The last 11 years have included all 11 of the warmest years observed in the instrumental record. For the last 50 years global warming has increased in lock-step with greenhouse gas forcing. Earth is currently at its warmest for at least several thousand of years, and possibly the warmest since the last interglacial period approximately 120,000 years ago.[viii] The speed of warming is rapid — more than ten times the speed of the fastest known natural sustained change.[x]
Note again, there is tremendous inertia in the system. Even if emissions of greenhouse gases were to suddenly stop, the heat trapping continues.
The temperature cannot stabilize while the concentration increases. The concentration cannot stabilize until we drastically cut emissions. The physics of the universe will not change.
In all scenarios, it will take the Earth thousands of years to return to pre-industrial era temperatures.[xi]
The global mean temperature trend 1850 – 2024 is below.[ix]
MY Predictions
My predictions, based on the climate data, energy transition and decarbonization trends, and taking into account current and projected human behaviours, are:
Humankind will push global warming beyond 2°C (100% probability)
Anthropogenic global warming will exceed 2°C before 2040 (75% probability)
Anthropogenic global warming will exceed 3°C before 2100 (60% probability)
Prediction #1 has remained unchanged since December 2017.
I have revised the probability for prediction #2 upwards as annual emissions continue to rise and because the data suggest reinforcing effects are accelerating the pace of warming.
With respect to Prediction #3, avoiding 3°C is well within our capacity. We already have all the technological means to do it. At the same time it requires humankind to want to do it, and to engage in a concerted, sustained and global effort to significantly cut emissions soon, one that goes beyond clean energy transitions in power grids and ground vehicles. Current socio-political developments appear to be further delaying significant emissions cuts, not bringing them closer.
REFERENCES
[i] Climate TRACE. “Climate TRACE.” Accessed September 18, 2026. https://climatetrace.org.
[ii] Ritchie, Hannah, Pablo Rosado, and Max Roser. “Greenhouse Gas Emissions.” Our World in Data, June 10, 2020. https://ourworldindata.org/greenhouse-gas-emissions.
[iii] Copernicus Climate Change Service “Climate Indicators: greenhouse gas concentrations.” Accessed September 18, 2026. https://climate.copernicus.eu/climate-indicators/greenhouse-gas-concentrations
[iv] “State of the Climate in 2025: Global Indicators.” AMS Headlines, August 10, 2026. https://headlines.ametsoc.org/2026/08/10/state-of-the-climate-in-2025-global-indicators/.
[v] “How Do We Know How Long Carbon Dioxide Remains in the Atmosphere? | MIT Climate Portal.” Accessed September 21, 2026. https://climate.mit.edu/ask-mit/how-do-we-know-how-long-carbon-dioxide-remains-atmosphere.
[vi] “Climate Change: Annual Greenhouse Gas Index | Climate.Us.” June 17, 2026. https://www.climate.us/news-features/understanding-climate/climate-change-annual-greenhouse-gas-index.
[vii] “Nitrous Oxide Emissions Grew 40 Percent from 1980 to 2020, Accelerating Climate Change.” Accessed September 18, 2026. https://cires.colorado.edu/news/nitrous-oxide-emissions-grew-40-percent-1980-2020-accelerating-climate-change.
[viii] Rohde, Robert. “Global Temperature Report for 2025.” Berkeley Earth, January 14, 2026. https://berkeleyearth.org/global-temperature-report-for-2025/.
[ix] World Meteorological Organization. “Global Mean Temperature 1850-2024.” Accessed September 18, 2026. https://wmo.int/resources/dashboards/global-mean-temperature-1850-2024.
[x] “Climate Is Always Changing. Why Is Climate Change of Concern Now? | Royal Society.” Accessed September 21, 2026. https://royalsociety.org/news-resources/projects/climate-change-evidence-causes/question-6/.
[xi] “If Emissions of Greenhouse Gases Were Stopped, Would the Climate Return to the Conditions of 200 Years Ago? | Royal Society.” Accessed April 18, 2026. https://royalsociety.org/news-resources/projects/climate-change-evidence-causes/question-20/.
***
Should you prefer to receive your futurism via inspired in-person storytelling, that’s my mission. Reach out, and let’s discuss a keynote or executive workshop tailored to the opportunities in your world.